Plataforma : Volfix
Volfix es una plataforma profesional de trading con más de 20 años de experiencia, diseñada para proporcionar un conjunto completo de herramientas de análisis de Order Flow y Volumen. Entre sus funcionalidades destacan los gráficos Cluster (Footprint), análisis de volumen, comparación de gráficos mediante 2nd Chart Study, Trading DOM (Depth of Market), datos agregados de Big Trades y mucho más.
Ventajas Principales
Visualización de volumen intuitiva y de primer nivel, sin configuraciones complejas e innecesarias.
Alta estabilidad de la plataforma, incluso al trabajar con decenas de ventanas simultáneamente, lo que se traduce en un uso significativamente menor de los recursos del sistema.
Todas las funcionalidades de la plataforma están incluidas en la licencia, ofreciendo un coste total más competitivo en comparación con otras soluciones del mercado.
Datos históricos de volumen disponibles desde 2008 y datos a nivel de tick (incluidos para pruebas y backtesting de estrategias) desde 2016.
Disponible para Windows, macOS y Linux, además de aplicaciones móviles para iOS y Android.
Funcionalidades Clave de la Plataforma Volfix
Gráfico Cluster (Footprint Chart). Permite analizar el interior de cada vela para identificar dónde se concentra el mayor volumen negociado. Gracias al gráfico Cluster, el trader puede visualizar con precisión dónde entra el dinero en el mercado y detectar áreas de interés institucional.
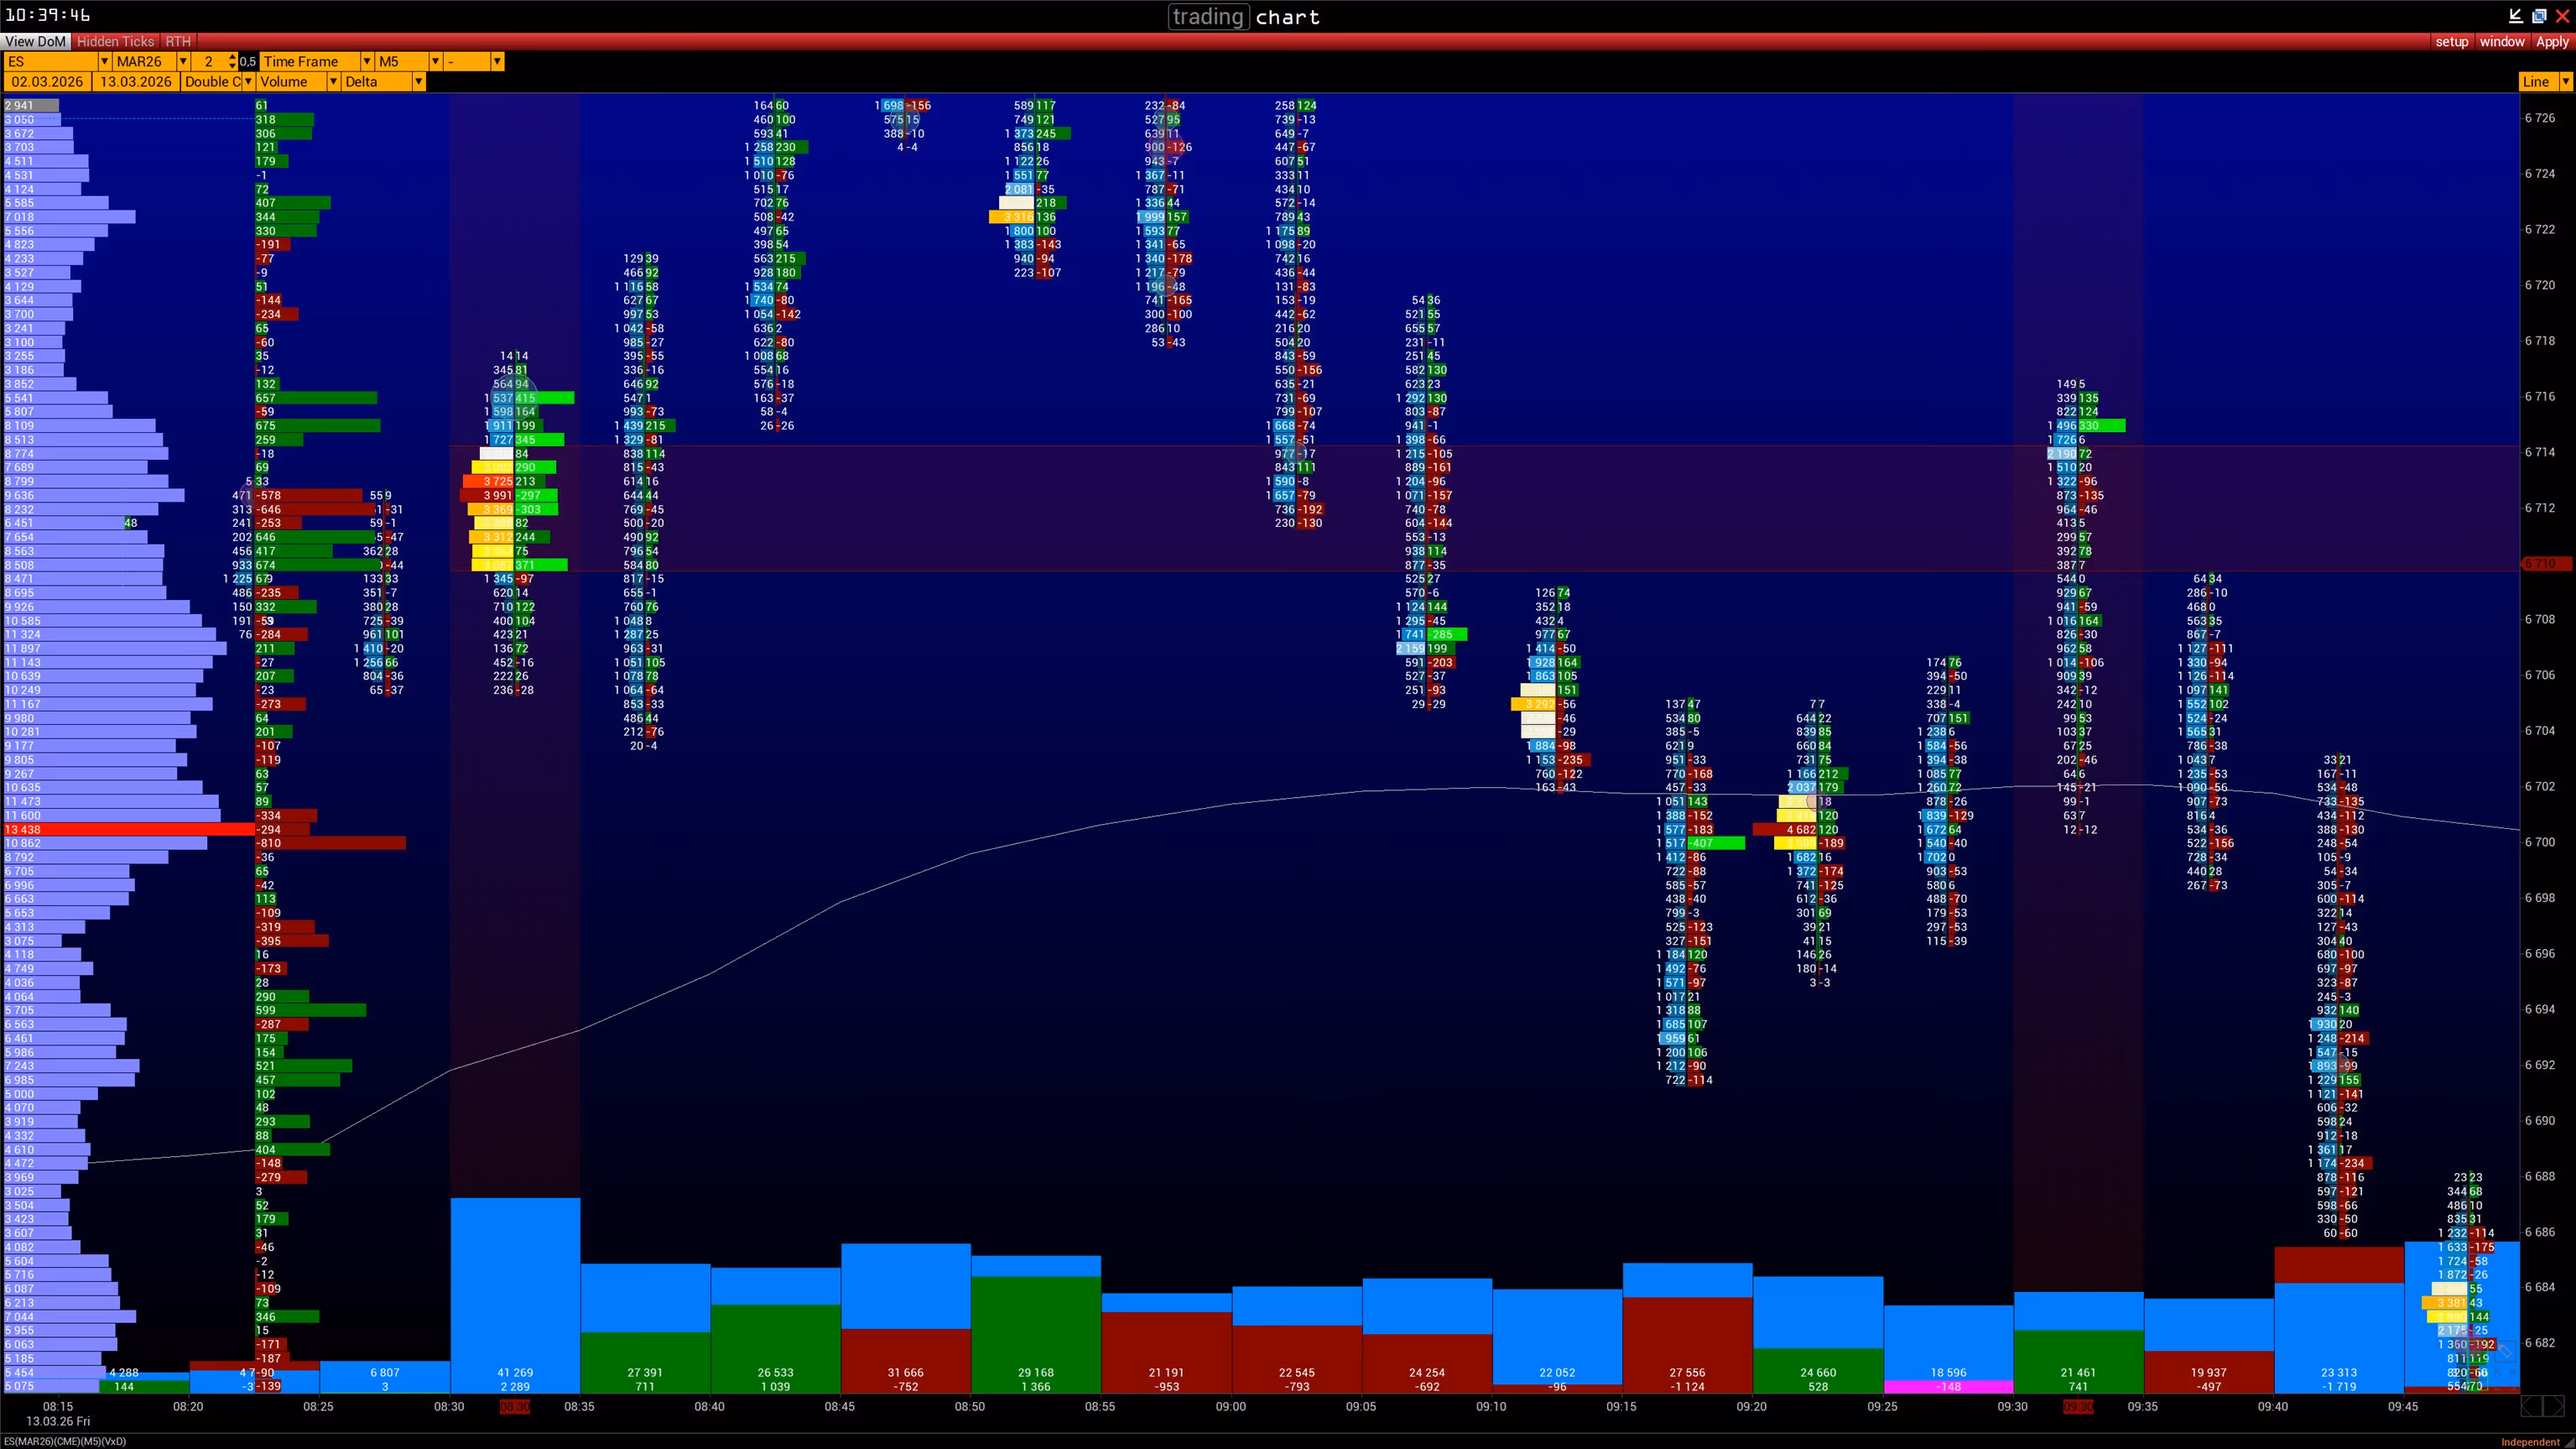
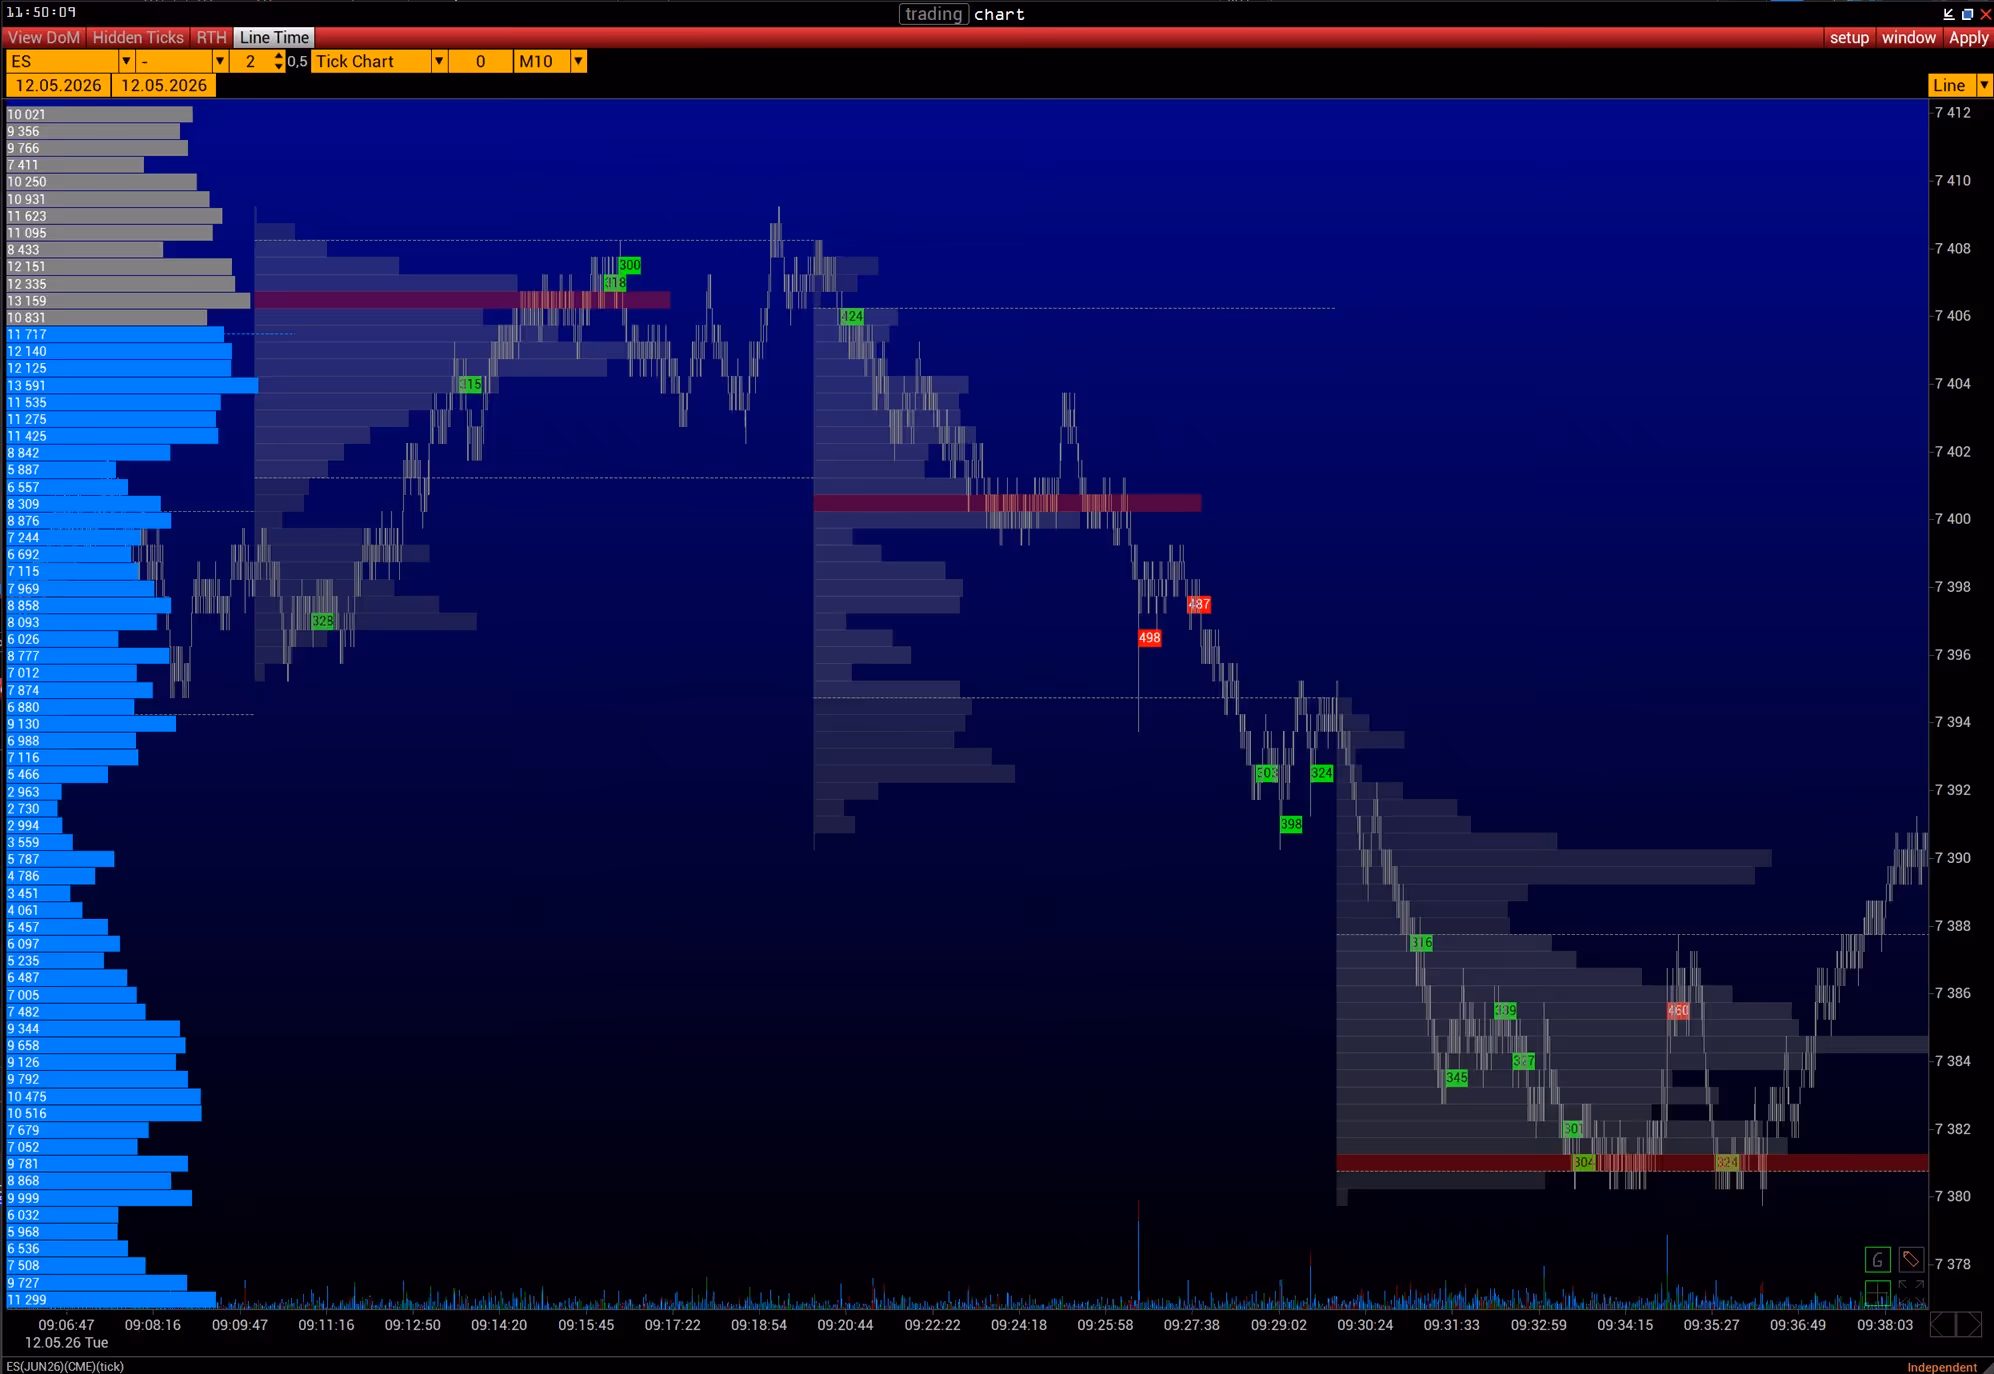
Gráfico Tick. Diseñado para analizar la actividad del mercado en la escala temporal más pequeña posible. Los gráficos Tick ofrecen una ventaja significativa para los traders intradía, permitiendo identificar los momentos de mayor actividad y volumen para optimizar la precisión de las entradas.
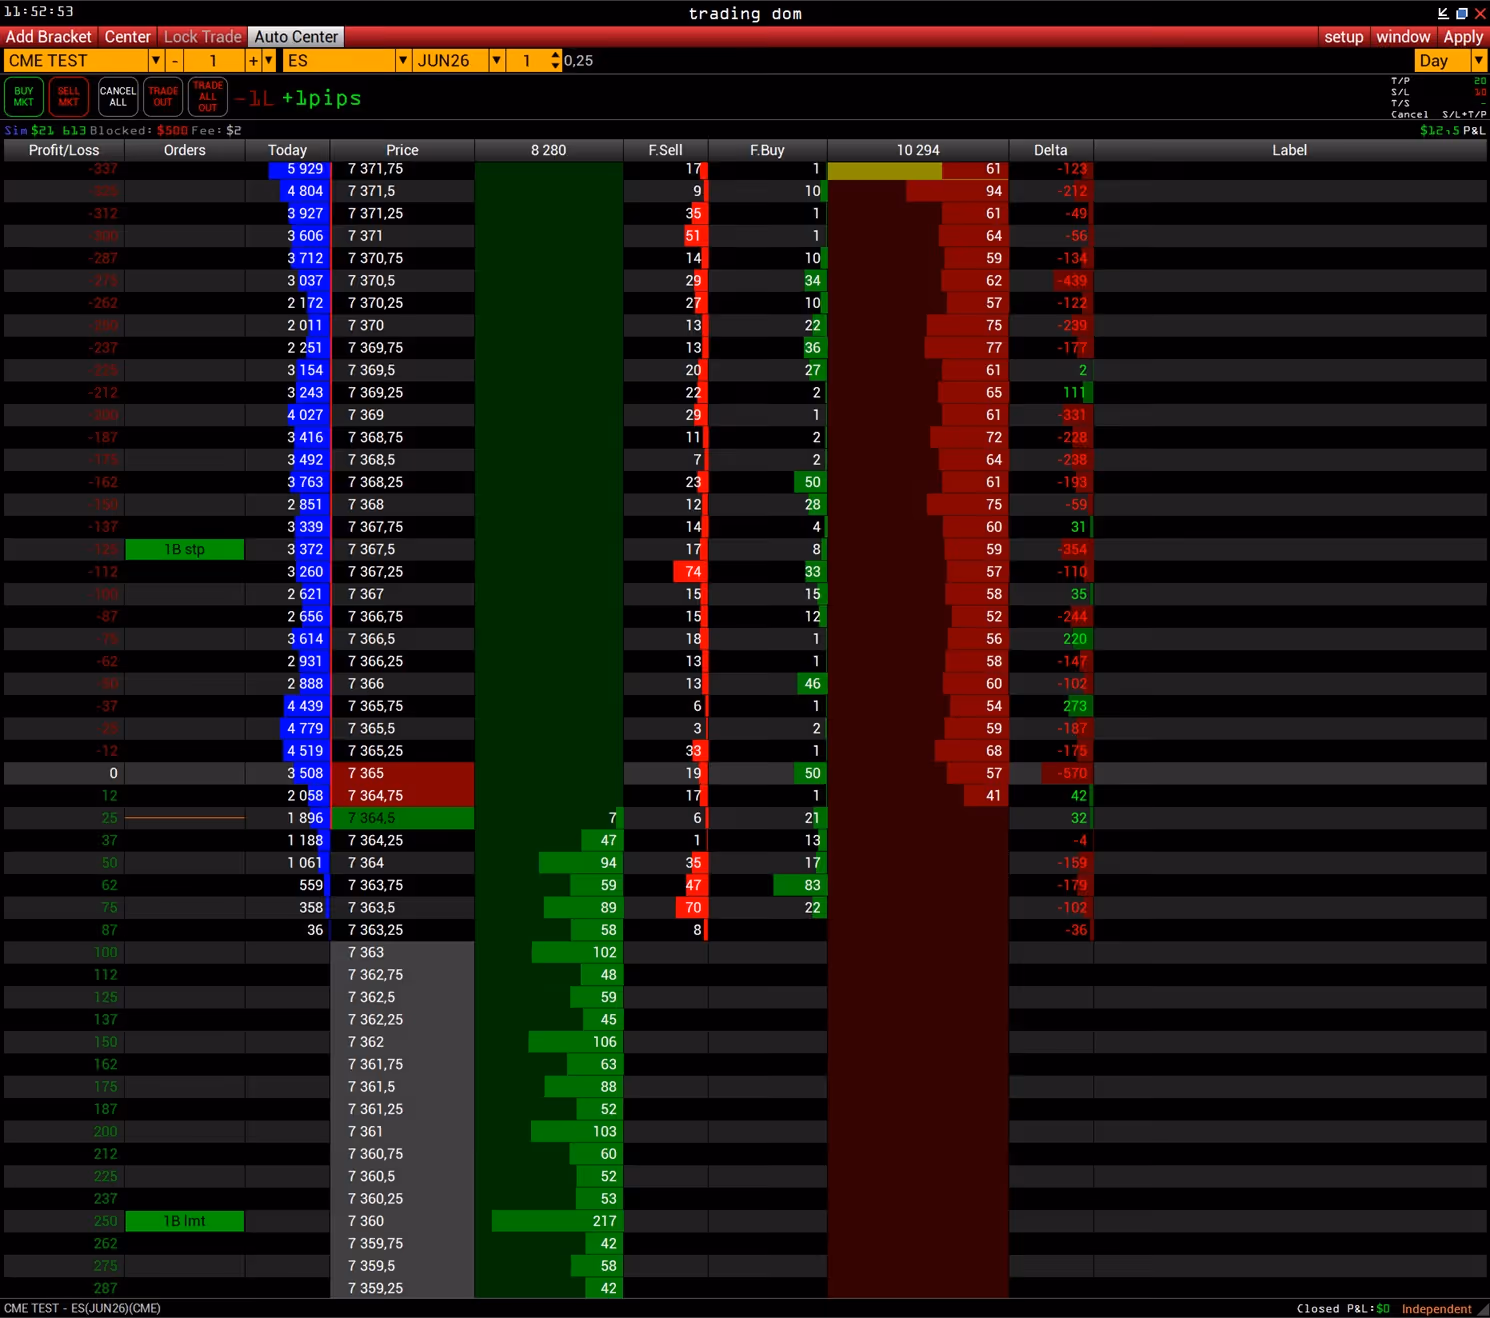
Trading DOM (Depth of Market). Un libro de órdenes interactivo que combina análisis y ejecución en una sola ventana. Proporciona todas las herramientas necesarias para el trading intradía y el scalping, permitiendo una lectura más precisa de la liquidez y del flujo de órdenes.
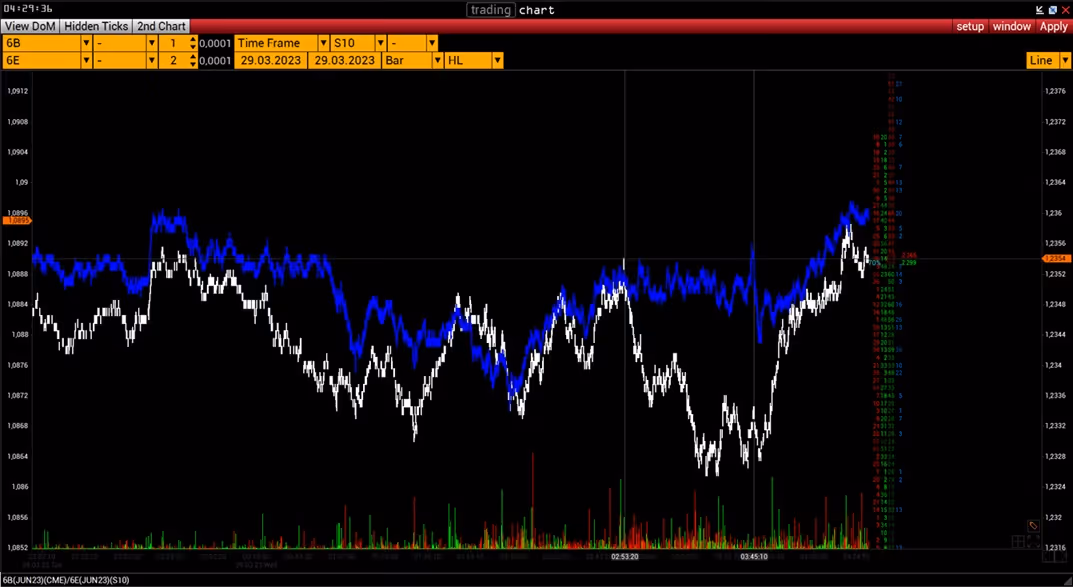
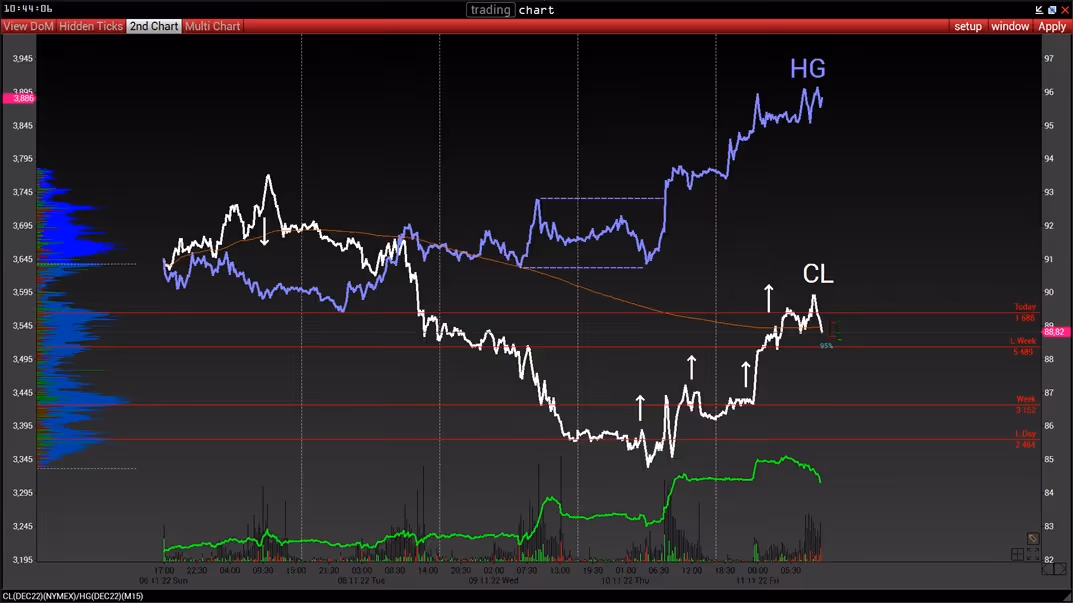
2nd Chart — Comparación de Activos. Volfix incorpora una herramienta única que permite comparar dos activos de forma directa y equivalente en términos monetarios.
En Structure-Trading, utilizamos esta funcionalidad de forma intensiva y exclusiva para analizar la relación entre los futuros NQ y ES.
El estudio 2nd Chart muestra instantáneamente si el spread es positivo o negativo y permite identificar qué activo está liderando el movimiento en cada momento.
Esta información proporciona una ventaja significativa para los traders que operan estrategias de spread trading, arbitraje relativo y análisis de fortaleza comparativa entre mercados.

Descargue Volfix.
Descargue Volfix para aprovechar al máximo sus funciones avanzadas y beneficiarse de una ejecución de órdenes más rápida y eficiente en los mercados.